What came down, and where.

Debris Mapping outlines destroyed structures and debris fields across the whole storm swath from very-high-resolution imagery, and flags the roads debris has closed, so you can size the clean-up contract from a dated map.

GSD
≤0.3 m (VHR)
Cadence
Event driven
Platform
VHR satellite / aerial
Spectral
RGB
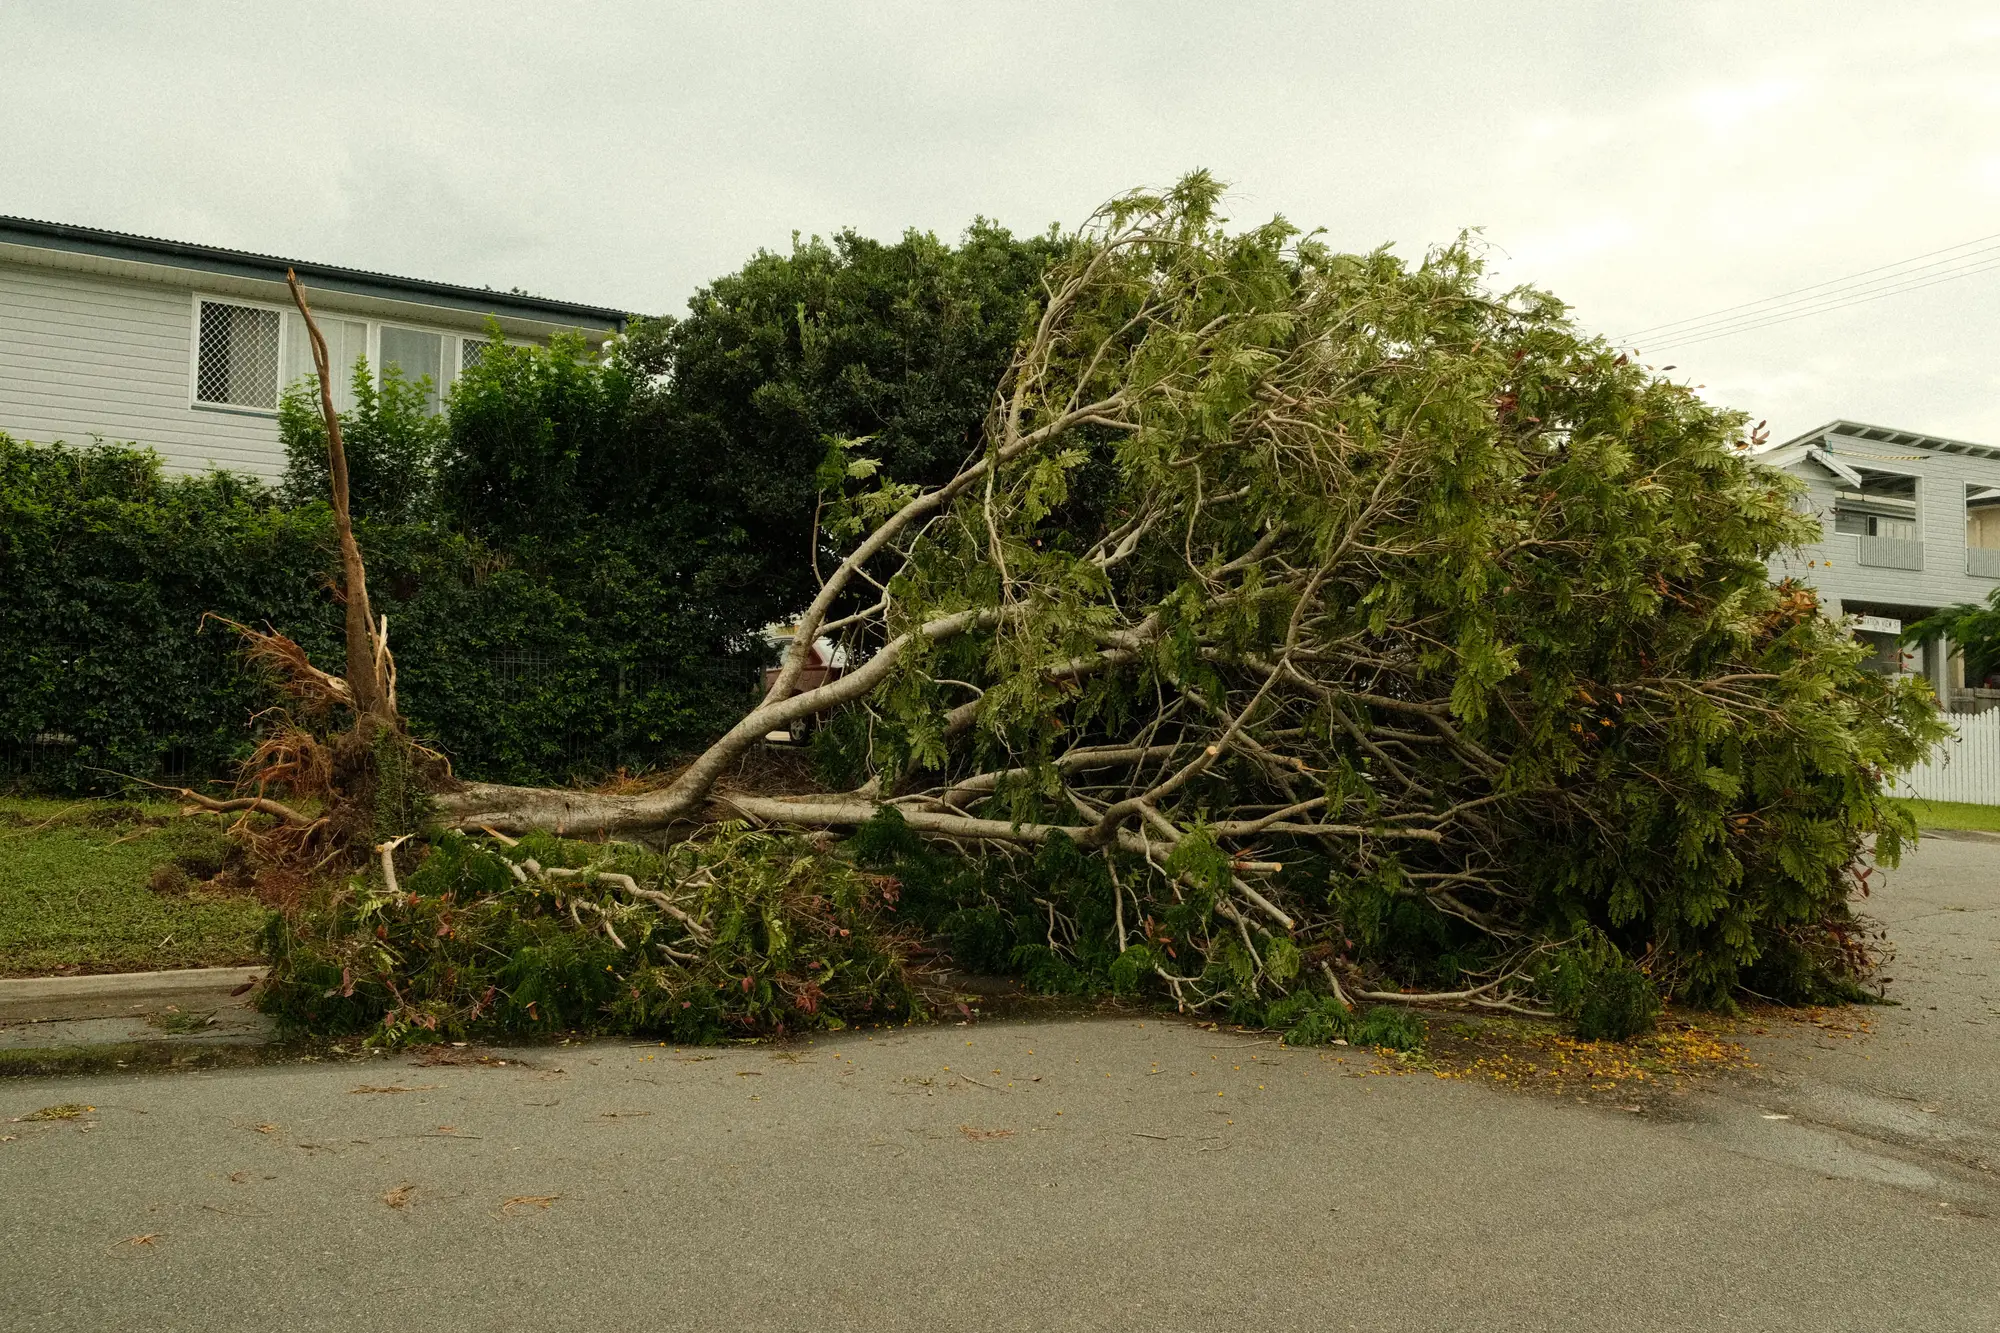
An uprooted tree lying across a suburban street after a windstorm

The job today

The first days after the wind

The storm passes overnight. By morning the damage assessment teams are out in trucks, driving the roads they can get down and calling each building destroyed, major or minor damage. Every team reports in its own way, by radio, by text and later on a form, and the tally at the EOC grows in pieces. Meanwhile the debris manager is on the phone with the pre-positioned contractor, who wants to know which areas to start in, and the logistics officer is asked for a scope for the task order. That scope needs an extent and a count. What the desk has is a list of the streets that got looked at.

The trouble is the ground nobody has reached yet. Limbs and trees close the roads the teams would need to drive, so the worst-hit stretch is often the one seen last, and a quiet subdivision with a clear road gets counted first. The contract gets sized from whichever part of the swath was easiest to reach. Then curbside piles start growing, and the scope is either too small to be safe or padded to be safe.

Fig. 1. A loose sketch of a storm swath with scattered debris and a few outlined structures. Schematic, not output.

A dated map of the whole swath changes the order of the week. The desk sees where the wreckage is thickest before the trucks get there, and the teams drive to confirm rather than to discover.

What you get

What comes back

  1. 2.1 Destroyed and damaged structure count

    CSV and GIS layer

    A count of destroyed structures and of visibly damaged ones inside the swath, dated to the image it came from. It lands on the logistics desk as one number per area you name, and the same structures sit as points in the layer.

  2. 2.2 Debris field extent

    GeoPackage or shapefile

    Debris fields drawn as polygons over the affected area. Use the outlines to see where the heaviest ground is and which areas the contractor takes first.

  3. 2.3 Right-of-way debris flags

    GIS layer

    Roads and access routes that debris appears to cross or fill, flagged for the route-clearing crews. Debris under canopy or in shadow is not always visible, so an unflagged road is not a cleared road.

  4. 2.4 GIS export

    Files for your GIS

    The same layers in files your county GIS opens, for the logistics desk and for the contractor's task order. The map is dated so that a later pass can show what has changed.

How it works

  1. Step 1 Area in

    You send the storm swath or the affected area, as a shapefile or a hand-drawn boundary, and tell us when the storm passed.

  2. Step 2 Imagery

    We look for the first usable, cloud-free VHR satellite or aerial pass over the swath after the storm. A trailing weather system can delay it.

  3. Step 3 Mapping

    Change detection and segmentation pick out destroyed structures and debris fields against the earlier imagery of the same ground, and mark the roads debris crosses.

  4. Step 4 Delivery

    The dated map, the counts and the files come back to you. We talk you through them on a call if you want that, and you take them from there to the scope of work.

Where it fits

For the task order

Use it as the first look across the swath. The debris field outlines show where the wreckage sits, the structure count gives you an extent to scope from, and the right-of-way flags tell the route-clearing crews which roads to open first.

Your assessment teams still drive the streets, confirm what the map shows, and record the damage categories your declaration paperwork needs. Nothing here counts cubic yards. Your debris monitors and load tickets still do that.

Limits

A storm front with rain shafts moving over open grassland
  1. L1 Only what the sky shows

    Optical imagery sees what is visible from above. Debris under tree canopy, inside buildings or in deep shadow may be missed, and a road we did not flag is not confirmed clear.

  2. L2 Resolution floor

    At 0.3 m a pixel is about a foot wide. A destroyed house and a large debris pile show up. Roof damage that is only missing shingles, and small limbs on a lawn, do not. The damaged-structure count is a looser call than the destroyed one.

  3. L3 First usable pass

    The map can only be as early as the first clear look. Cloud, smoke or a second front can hold it back, so there is no fixed turnaround.

  4. L4 No volumes

    We map extent and count structures. We do not estimate cubic yards or tonnage, and the count is not a damage valuation.

  5. L5 Not an assessment record

    This does not replace the damage assessment your declaration needs, and it is not for insurance claims.

Who it's for

For

  • Logistics officers and debris managers sizing a clean-up task order after a windstorm
  • County or city emergency management staff who need a whole-swath picture before every road has been driven
  • GIS coordinators who feed the EOC a layer on the day

Not for

  • Insurance adjusters valuing damage for a claim
  • Buyers who want a debris volume in cubic yards
  • Flood, wildfire, or earthquake response
  • Rescue or search operations

FAQ

Questions before an event

How fast after the storm is this available?

It depends on the first usable, cloud-free pass over your swath. A trailing weather system can delay that, so we tell you what the imagery calendar looks like once we know your area and the date.

Does this give us debris tonnage or cubic yards?

No. It maps where the debris is and counts structures. Volumes still come from your debris monitors and load tickets.

Does this replace our windshield survey?

No. It narrows where crews look first and helps you size the scope while roads are still closed. A field check confirms the specifics.

How do we check it against our own assessment?

Compare the structure count and the debris outlines with your teams' tally for an area they have finished driving, and decide how far to lean on it for the rest of the swath.

What about debris under trees?

Optical imagery only sees what is visible from above. Debris under canopy may be missed, and we say so on the map.

Can it cover a whole storm track?

Across the swath you define, as far as imagery for that area is available.

Will it load into our GIS?

It comes as a GIS layer plus a CSV of counts, as a shapefile or GeoPackage. Tell us which GIS you run and we will say how it loads.

Who owns the results and the imagery?

Ownership and licence terms for the files and the underlying imagery are agreed in writing before an order is placed. Ask for them early if your county attorney needs to look.

How is it bought and priced?

The quote depends on the size of the swath and the imagery source. Tell us how your county buys services and we will scope it to fit.

Have the map ready before the next storm.

Tell us the area you cover and how your task orders are issued. We will say what a request looks like and how the imagery calendar affects it.

Get started